

Contributions
Abstract: EP880
Type: E-Poster Presentation
Session title: Lymphoma Biology & Translational Research
Background
Several studies have suggested that tumor microenvironment (TME) could play an important role in lymphomagenesis and tumor progression in non-Hodgkin lymphoma. Gene-expression signatures derived from nonmalignant cells in the tumors, that predict survival, were identified in follicular lymphoma (FL). However, these molecular tools are not widely available and TME variables that could be easily translated into clinically relevant prognostic biomarkers are still missing in FL.
Aims
To determine the prognostic impact on survival of the percentage (%) of T lymphocytes (TL), measured by flow cytometry (FC), in tissue biopsies of FL patients (pts) at diagnosis and to evaluate whether these variables can provide additional information when superimposed on the FLIPI.
Methods
We selected pts with grade I-IIIa FL and available tissue biopsy FC data at the time of diagnosis who received treatment at our institution between 2007 and 2018. Clinical information was collected from medical records.
FC analysis was performed with 8-color FC panels according to international Euroflow protocols. % of lymph node TL by FC was compared to the normal values determined by Battaglia et al (Immunology 2003), and analyzed as an ordinal variable in 3 categories: low, normal and high. Progression free survival (PFS) was estimated with Kaplan-Meier method. The comparison between variables was performed with log-rank test and Cox proportional hazards model.
Results
60 pts were included in this retrospective study. Median age was 57.5 years. 75% had stage III-IV disease. 28.3% of pts were stratified as high risk according to FLIPI-1 and only 13.3% with FLIPI-2 and PRIMA-PI. 23.3% were treated with Rituximab monotherapy and the remaining with Rituximab + CHOP, CVP or bendamustine. Complete response rate was 91.7%. 46 pts (76.6%) received Rituximab maintenance. POD24 was observed in 5 pts. Median PFS was estimated in 97.4 months. Only 3 pts died in our cohort with a median follow up time of 5.7 years.
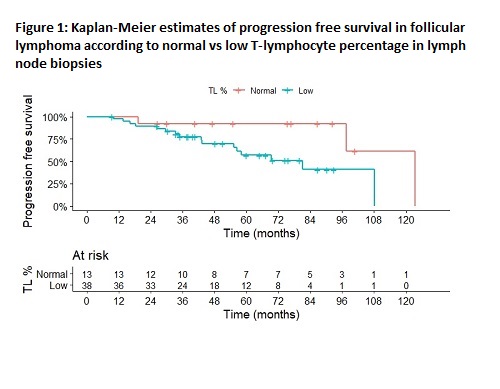
A low % of TL in lymph nodes was associated with inferior PFS (hazard ratio 4.66, 95% confidence interval 1.02-21.21, p:0.046, figure 1). Median PFS in pts with normal lymph node TL % was 123.3 months compared to only 81 months in the low TL risk subgroup (p:0.05). There was also a trend towards worse outcomes in pts with high lymph node TL although not statistically significant (hazard ratio 11.17, 95% confidence interval 0.91-136, p:0.058).
Lymph node TL % was able to further stratify clinical outcome in pts with low risk FLIPI-2. 75th percentile PFS for the low risk subgroup was estimated at 55.3 months but could improve to up to 97.4 months if normal TL % was detected, p:0.032. The same trend was observed in FLIPI-1 low risk pts (estimated 75th percentile of 55.3 months for the whole low risk category and of 29.6 and 97.4 months for the low and normal TL % subgroups, respectively; p:0.064).
Conclusion
Low TL percentage in lymph nodes of pts with FL was associated with inferior outcomes in our cohort. First line therapies including an immunomodulatory agent such as lenalidomide could constitute an interesting strategy to restore a favorable immune microenvironment in this setting. Furthermore, the percentage of TL was able to provide additional prognostic information when combined with low risk FLIPI, identifying a subgroup with truly indolent behavior with 75% showing no evidence of relapse in more than 8 years. Data obtained from FC is easily acquired and should be taken into consideration when studying TME in FL.
Keyword(s): Flow cytometry, Follicular lymphoma, Microenvironment, T lymphocyte
Abstract: EP880
Type: E-Poster Presentation
Session title: Lymphoma Biology & Translational Research
Background
Several studies have suggested that tumor microenvironment (TME) could play an important role in lymphomagenesis and tumor progression in non-Hodgkin lymphoma. Gene-expression signatures derived from nonmalignant cells in the tumors, that predict survival, were identified in follicular lymphoma (FL). However, these molecular tools are not widely available and TME variables that could be easily translated into clinically relevant prognostic biomarkers are still missing in FL.
Aims
To determine the prognostic impact on survival of the percentage (%) of T lymphocytes (TL), measured by flow cytometry (FC), in tissue biopsies of FL patients (pts) at diagnosis and to evaluate whether these variables can provide additional information when superimposed on the FLIPI.
Methods
We selected pts with grade I-IIIa FL and available tissue biopsy FC data at the time of diagnosis who received treatment at our institution between 2007 and 2018. Clinical information was collected from medical records.
FC analysis was performed with 8-color FC panels according to international Euroflow protocols. % of lymph node TL by FC was compared to the normal values determined by Battaglia et al (Immunology 2003), and analyzed as an ordinal variable in 3 categories: low, normal and high. Progression free survival (PFS) was estimated with Kaplan-Meier method. The comparison between variables was performed with log-rank test and Cox proportional hazards model.
Results
60 pts were included in this retrospective study. Median age was 57.5 years. 75% had stage III-IV disease. 28.3% of pts were stratified as high risk according to FLIPI-1 and only 13.3% with FLIPI-2 and PRIMA-PI. 23.3% were treated with Rituximab monotherapy and the remaining with Rituximab + CHOP, CVP or bendamustine. Complete response rate was 91.7%. 46 pts (76.6%) received Rituximab maintenance. POD24 was observed in 5 pts. Median PFS was estimated in 97.4 months. Only 3 pts died in our cohort with a median follow up time of 5.7 years.
A low % of TL in lymph nodes was associated with inferior PFS (hazard ratio 4.66, 95% confidence interval 1.02-21.21, p:0.046, figure 1). Median PFS in pts with normal lymph node TL % was 123.3 months compared to only 81 months in the low TL risk subgroup (p:0.05). There was also a trend towards worse outcomes in pts with high lymph node TL although not statistically significant (hazard ratio 11.17, 95% confidence interval 0.91-136, p:0.058).
Lymph node TL % was able to further stratify clinical outcome in pts with low risk FLIPI-2. 75th percentile PFS for the low risk subgroup was estimated at 55.3 months but could improve to up to 97.4 months if normal TL % was detected, p:0.032. The same trend was observed in FLIPI-1 low risk pts (estimated 75th percentile of 55.3 months for the whole low risk category and of 29.6 and 97.4 months for the low and normal TL % subgroups, respectively; p:0.064).
Conclusion
Low TL percentage in lymph nodes of pts with FL was associated with inferior outcomes in our cohort. First line therapies including an immunomodulatory agent such as lenalidomide could constitute an interesting strategy to restore a favorable immune microenvironment in this setting. Furthermore, the percentage of TL was able to provide additional prognostic information when combined with low risk FLIPI, identifying a subgroup with truly indolent behavior with 75% showing no evidence of relapse in more than 8 years. Data obtained from FC is easily acquired and should be taken into consideration when studying TME in FL.
Keyword(s): Flow cytometry, Follicular lymphoma, Microenvironment, T lymphocyte