

Contributions
Abstract: EP581
Type: E-Poster Presentation
Session title: Bone marrow failure syndromes incl. PNH - Biology & Translational Research
Background
Both hypoplastic myelodysplastic syndrome (hypo-MDS) and aplastic anemia (AA) are bone marrow failure. Although they display multiple similarities in clinical characterizations, there are great differences in the treatment and prognosis. It is necessary to distinguish them. It is now well established that abnormal lymphocyte subsets play an important role in hypo-MDS and AA. However, there was no report about the difference of lymphocyte subsets between hypo-MDS and AA.
Aims
This study aims to compare the proportion of peripheral blood lymphocyte subsets between patients with hypoplastic myelodysplastic syndrome (hypo-MDS) and aplastic anemia (AA).
Methods
A total of 25 patients with hypo-MDS and 33 patients with AA were collected, and the proportions of peripheral blood T lymphocyte subsets, CD3-CD16/CD56+ NK cells and CD19+ B cells were detected by flow cytometry. The landscape of infiltrating lymphocyte cells in hypo-MDS and AA were detected by single-cell sequencing.
Results
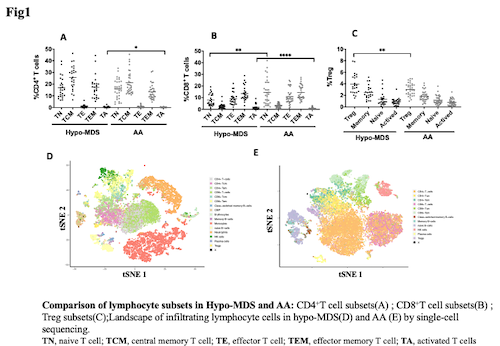
Although the proportions of total lymphocyte, CD3+ T cells and CD3+CD8+ T cells were higher in AA patients than those in MDS patients, there was no significant difference. The CD4+/CD8+ ratio was statistically lower in AA than that in hypo-MDS (P<0.05). There were no significant difference in the proportions of CD3-CD16/CD56+ NK cells and CD19+ B cells. Furthermore, we divided the CD4+ T cells and CD8+ T cells to five subgroups, which named naive T cell (TN), central memory T cell (TCM), effector T cell (TE), effector memory T cell (TEM), and activated T cells (TA), and the Treg to three subgroups, which containing memory Treg, naive Treg and activated Treg. The TA proportions of CD4+ and CD8+ T cells in AA patients were obviously lower than those in the hypo-MDS group (P<0.05 and P< 0.0001). The TN proportion of CD8+ T cells in the AA patients was obviously higher than that in the hypo-MDS patients (P < 0.01). The Tregs in AA patients was obviously lower than that in hypo-MDS patients (P<0.05). There were no significant difference in other subgroups between AA and hypo-MDS patients. There was difference in the landscape of infiltrating lymphocyte cells in hypo-MDS and AA detected by single-cell sequencing.
Conclusion
Changes of lymphocyte subsets and the different landscape of infiltrating lymphocyte cells can be utilized as indexes in the differential diagnosis between AA and hypo-MDS.
Keyword(s): Aplastic anemia, MDS
Abstract: EP581
Type: E-Poster Presentation
Session title: Bone marrow failure syndromes incl. PNH - Biology & Translational Research
Background
Both hypoplastic myelodysplastic syndrome (hypo-MDS) and aplastic anemia (AA) are bone marrow failure. Although they display multiple similarities in clinical characterizations, there are great differences in the treatment and prognosis. It is necessary to distinguish them. It is now well established that abnormal lymphocyte subsets play an important role in hypo-MDS and AA. However, there was no report about the difference of lymphocyte subsets between hypo-MDS and AA.
Aims
This study aims to compare the proportion of peripheral blood lymphocyte subsets between patients with hypoplastic myelodysplastic syndrome (hypo-MDS) and aplastic anemia (AA).
Methods
A total of 25 patients with hypo-MDS and 33 patients with AA were collected, and the proportions of peripheral blood T lymphocyte subsets, CD3-CD16/CD56+ NK cells and CD19+ B cells were detected by flow cytometry. The landscape of infiltrating lymphocyte cells in hypo-MDS and AA were detected by single-cell sequencing.
Results
Although the proportions of total lymphocyte, CD3+ T cells and CD3+CD8+ T cells were higher in AA patients than those in MDS patients, there was no significant difference. The CD4+/CD8+ ratio was statistically lower in AA than that in hypo-MDS (P<0.05). There were no significant difference in the proportions of CD3-CD16/CD56+ NK cells and CD19+ B cells. Furthermore, we divided the CD4+ T cells and CD8+ T cells to five subgroups, which named naive T cell (TN), central memory T cell (TCM), effector T cell (TE), effector memory T cell (TEM), and activated T cells (TA), and the Treg to three subgroups, which containing memory Treg, naive Treg and activated Treg. The TA proportions of CD4+ and CD8+ T cells in AA patients were obviously lower than those in the hypo-MDS group (P<0.05 and P< 0.0001). The TN proportion of CD8+ T cells in the AA patients was obviously higher than that in the hypo-MDS patients (P < 0.01). The Tregs in AA patients was obviously lower than that in hypo-MDS patients (P<0.05). There were no significant difference in other subgroups between AA and hypo-MDS patients. There was difference in the landscape of infiltrating lymphocyte cells in hypo-MDS and AA detected by single-cell sequencing.
Conclusion
Changes of lymphocyte subsets and the different landscape of infiltrating lymphocyte cells can be utilized as indexes in the differential diagnosis between AA and hypo-MDS.
Keyword(s): Aplastic anemia, MDS