

Contributions
Abstract: EP407
Type: E-Poster Presentation
Session title: Acute myeloid leukemia - Biology & Translational Research
Background
MRD monitoring is now mandatory for treatment response evaluation in AML clinical trials (ELN-2017 guidelines). In this setting, beside to molecular biology methods, multiparameter flow cytometry assay represents the most reliable approach.
Aims
The aim of this study was to compare conventional MRD flow analysis (LAIP/diff normal) versus computer aided design (CAD) flow in assessment of AML MRD flow using panel and settings of -ALFA French Flow AML MRD.
Methods
120 Bone marrow AML samples issued from 60 patients (between 2018-2020) who received conventional chemotherapy regimen (3+7) or Vyxeos, 30 diagnosis and 30 follow-up MRD1 after induction.
Results
The CAD method is based on the use of an R script that compares the MRD sample to a panel of 20 reference BM and the diagnostic sample using the unsupervised clusterisantion method flowsom. It is applied following a basic cytometry analytical strategy of cleaning up confounding events (debris, aggregates...). It can be used with any software that can extract data from cytometry files (FCS, LMD) in the form of text files of type csv (comma separated values). The script then combines the files extracted from the follow-up diagnosis and the reference samples.
The extracted data are limited to blast populations (SSlow CD45+ CD117+ and or CD34+) that have been perfectly cleaned of cell debris or doublets or contamination by mature cells.
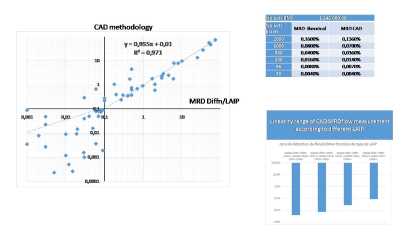
Carries out an unsupervised clustering on all the data with the FlowSOM algorithm, then produces an FCS file that integrates the results of this unsupervised clustering into additional parameters (FlowSOM mapping, metacluster among others). It is then easy to reuse this new FCS file in a cytometry software and to condition the populations on the results of this clustering in order to quantify the residual population and compare it to the reference bone marrows.Finally, our script performs a pre-analysis: it identifies and quantifies the SOM flow metaclusters in the CD34+ CD117+ space for all samples (diagnosis, followup and references). It then extracts the metacluster whose proportion of events at the monitoring point is significantly different from that observed for the reference pith (> mean+6sd) and displays the combination(s). It calculates the mrd in % of WBC CD45+ of the owup sample. The limits of sensitivity of the CAD method shows that a MRD remains evaluable by CAD up to 0.004% (50 events in 1 000 000). We compared the results between the conventional method and the CAD method on 60 MRD sample half from BDplatform and half from navios platform, the slope of the correlation line was 0.95 with an R2 of 0.97 and the coeficient as shown in Figure 1.Using the definition threshold of a positive MRD at 0.1%, the agreement of the results between the two methods was evaluated by the cohen kappa coeficient of 0.87, which reflects an almost perfect agreement between the two methods.
Conclusion
The advantage of this way of proceeding lies on the one hand in the rapidity of the detection of abnormal populations : the calculations performed by the PC being relatively fast <1min, but also in the absence of subjectivity of the observer : the metaclusters are determined by the algorithm and clearly identified in the file resulting from the script and finally a major advance : the comparison of the follow-up sample to the reference samples is independent of the diagnostic sample allowing detection of phenotypic shift. Finally, this method shows a very strong correlation with the conventional method.
Keyword(s): AML, Flow cytometry, MRD
Abstract: EP407
Type: E-Poster Presentation
Session title: Acute myeloid leukemia - Biology & Translational Research
Background
MRD monitoring is now mandatory for treatment response evaluation in AML clinical trials (ELN-2017 guidelines). In this setting, beside to molecular biology methods, multiparameter flow cytometry assay represents the most reliable approach.
Aims
The aim of this study was to compare conventional MRD flow analysis (LAIP/diff normal) versus computer aided design (CAD) flow in assessment of AML MRD flow using panel and settings of -ALFA French Flow AML MRD.
Methods
120 Bone marrow AML samples issued from 60 patients (between 2018-2020) who received conventional chemotherapy regimen (3+7) or Vyxeos, 30 diagnosis and 30 follow-up MRD1 after induction.
Results
The CAD method is based on the use of an R script that compares the MRD sample to a panel of 20 reference BM and the diagnostic sample using the unsupervised clusterisantion method flowsom. It is applied following a basic cytometry analytical strategy of cleaning up confounding events (debris, aggregates...). It can be used with any software that can extract data from cytometry files (FCS, LMD) in the form of text files of type csv (comma separated values). The script then combines the files extracted from the follow-up diagnosis and the reference samples.
The extracted data are limited to blast populations (SSlow CD45+ CD117+ and or CD34+) that have been perfectly cleaned of cell debris or doublets or contamination by mature cells.
Carries out an unsupervised clustering on all the data with the FlowSOM algorithm, then produces an FCS file that integrates the results of this unsupervised clustering into additional parameters (FlowSOM mapping, metacluster among others). It is then easy to reuse this new FCS file in a cytometry software and to condition the populations on the results of this clustering in order to quantify the residual population and compare it to the reference bone marrows.Finally, our script performs a pre-analysis: it identifies and quantifies the SOM flow metaclusters in the CD34+ CD117+ space for all samples (diagnosis, followup and references). It then extracts the metacluster whose proportion of events at the monitoring point is significantly different from that observed for the reference pith (> mean+6sd) and displays the combination(s). It calculates the mrd in % of WBC CD45+ of the owup sample. The limits of sensitivity of the CAD method shows that a MRD remains evaluable by CAD up to 0.004% (50 events in 1 000 000). We compared the results between the conventional method and the CAD method on 60 MRD sample half from BDplatform and half from navios platform, the slope of the correlation line was 0.95 with an R2 of 0.97 and the coeficient as shown in Figure 1.Using the definition threshold of a positive MRD at 0.1%, the agreement of the results between the two methods was evaluated by the cohen kappa coeficient of 0.87, which reflects an almost perfect agreement between the two methods.
Conclusion
The advantage of this way of proceeding lies on the one hand in the rapidity of the detection of abnormal populations : the calculations performed by the PC being relatively fast <1min, but also in the absence of subjectivity of the observer : the metaclusters are determined by the algorithm and clearly identified in the file resulting from the script and finally a major advance : the comparison of the follow-up sample to the reference samples is independent of the diagnostic sample allowing detection of phenotypic shift. Finally, this method shows a very strong correlation with the conventional method.
Keyword(s): AML, Flow cytometry, MRD