

Contributions
Abstract: PB1924
Type: Publication Only
Background
The belief that "not only the response, but also the early response to therapy" predicts the best long term clinical outcome is common in chronic myeloid leukemia (CML). The latest data do not confirm that time to response is relevant for overall survival.
Aims
The aim of this study was to check it on the data of the Russian CML Registy and on simulation model.
Methods
Russian CML Registry include more than 10 thousand patients (pts) data. In the analysis 8326 CML pts in chronic phase(CP) with first line TKI therapy were included: 91% of pts were treated by Imatinib and 9% by other TKIs. Mean age was 47.3 years, 4607 f / 3705 m. Date of Complete Cytogenetic Response (CCyR) was assessed as the date of first test with 0% of Ph’+ cells or date of molecular test with BCR/ABL ≤0.1% IS. Overall survival (OS) was estimated starting land-mark (LM) time point, event was death from any reason, date of last contact was censored for alive pts. Survival analysis and simulation was performed by SAS statistics. Distribution of time to response and to death was modeled as mixture of exponents with parameters fitted to real data.
Results
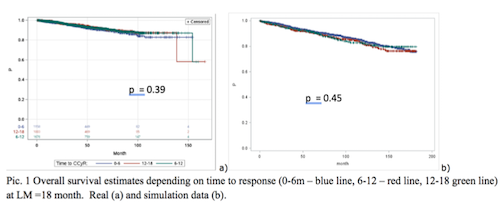
Firstly we followed traditional way and compared overall survival estimates (OS) depending upon the response status (yes/no) at several LM time points (table 1,a).There are significant differences in OS at all LMs as expected. Then in the analysis we included only responded pts at a LM time =18 months and compared OS in 3 groups with different times to response: 0-6 months, 6-12 months, 12-18 months (pic.1,a). There are no significant differences in OS. The COX regression analysis also does not find significant influence of time to response on the OS. The distribution of time to response was fitted by the mixture of 3 exponents related 3 groups of responders: fast-runners, moderate-runners and resistant pts. The parameters was following: 1 group: 6.5m, 60%, 2 group: 35 m, 32%, 3 group: 220 m, 8%, where fist value is mean time to respond, second – portion in cohort. Then we suppose that mean life duration in 1 and 2 groups equal to 50years, and for 3 group - 9 years. The simulation results for n=5000 pts is displayed in table 1, b and picture 1, b.: The deal is that in LM analysis you compare the group of fast-runner with mixture of slow runners and “never” responders. The result depends upon the proportion of compounds in the second group. So, our analysis does not confirm significant correlation of the survival and speed of respond.
LM | a) Real registery data | b) Simulation data |
10years OS, CCyR vs nonCCyR | 10years OS, CCyR vs nonCCyR | |
6m | 82% vs 73% | 84% vs 74% |
12m | 85% vs 67% | 84% vs 69% |
18m | 86% vs 63% | 83% vs 67% |
Table 1. LM OS estimates of responder vs non-responders, all p<0.001. Real (a) and simulation (b) data
Conclusion
The population of CML pts is a mixture of “any time” responders and “never”-responders. Tradition LM analysis output is wrong treated as evidence that survival depends of the time to respond. More specific analysis does not confirm that. This was demonstrated on big population data and explained by simulation model.
Session topic: 8. Chronic myeloid leukemia - Clinical
Keyword(s): Chronic myeloid leukemia, Population, Survival prediction
Abstract: PB1924
Type: Publication Only
Background
The belief that "not only the response, but also the early response to therapy" predicts the best long term clinical outcome is common in chronic myeloid leukemia (CML). The latest data do not confirm that time to response is relevant for overall survival.
Aims
The aim of this study was to check it on the data of the Russian CML Registy and on simulation model.
Methods
Russian CML Registry include more than 10 thousand patients (pts) data. In the analysis 8326 CML pts in chronic phase(CP) with first line TKI therapy were included: 91% of pts were treated by Imatinib and 9% by other TKIs. Mean age was 47.3 years, 4607 f / 3705 m. Date of Complete Cytogenetic Response (CCyR) was assessed as the date of first test with 0% of Ph’+ cells or date of molecular test with BCR/ABL ≤0.1% IS. Overall survival (OS) was estimated starting land-mark (LM) time point, event was death from any reason, date of last contact was censored for alive pts. Survival analysis and simulation was performed by SAS statistics. Distribution of time to response and to death was modeled as mixture of exponents with parameters fitted to real data.
Results
Firstly we followed traditional way and compared overall survival estimates (OS) depending upon the response status (yes/no) at several LM time points (table 1,a).There are significant differences in OS at all LMs as expected. Then in the analysis we included only responded pts at a LM time =18 months and compared OS in 3 groups with different times to response: 0-6 months, 6-12 months, 12-18 months (pic.1,a). There are no significant differences in OS. The COX regression analysis also does not find significant influence of time to response on the OS. The distribution of time to response was fitted by the mixture of 3 exponents related 3 groups of responders: fast-runners, moderate-runners and resistant pts. The parameters was following: 1 group: 6.5m, 60%, 2 group: 35 m, 32%, 3 group: 220 m, 8%, where fist value is mean time to respond, second – portion in cohort. Then we suppose that mean life duration in 1 and 2 groups equal to 50years, and for 3 group - 9 years. The simulation results for n=5000 pts is displayed in table 1, b and picture 1, b.: The deal is that in LM analysis you compare the group of fast-runner with mixture of slow runners and “never” responders. The result depends upon the proportion of compounds in the second group. So, our analysis does not confirm significant correlation of the survival and speed of respond.
LM | a) Real registery data | b) Simulation data |
10years OS, CCyR vs nonCCyR | 10years OS, CCyR vs nonCCyR | |
6m | 82% vs 73% | 84% vs 74% |
12m | 85% vs 67% | 84% vs 69% |
18m | 86% vs 63% | 83% vs 67% |
Table 1. LM OS estimates of responder vs non-responders, all p<0.001. Real (a) and simulation (b) data
Conclusion
The population of CML pts is a mixture of “any time” responders and “never”-responders. Tradition LM analysis output is wrong treated as evidence that survival depends of the time to respond. More specific analysis does not confirm that. This was demonstrated on big population data and explained by simulation model.
Session topic: 8. Chronic myeloid leukemia - Clinical
Keyword(s): Chronic myeloid leukemia, Population, Survival prediction