

Contributions
Abstract: S1566
Type: Oral Presentation
Presentation during EHA23: On Sunday, June 17, 2018 from 08:15 - 08:30
Location: Room K1
Background
ALL is heterogeneous in terms of genetics, clinical presentation and therapy response. Risk stratification, based on diagnostic features and early treatment response, has improved outcome. However, current algorithms use risk factors as binary variables which reduces statistical power and fails to account for biological heterogeneity. Moreover, using thresholds results in fixed group sizes which reduces options when designing clinical trials.
Aims
To develop a prognostic index (PI) which (a) integrates genetic, clinical and response data; (b) utilises continuous data; and (c) can be used to define clinically meaningful risk groups.
Methods
The discovery cohort comprised 2,542 UKALL203 patients who achieved a morphological remission. The validation cohort comprised 2,470 patients treated on the COALL-03, DCOG-ALL10 or NOPHO-ALL2008 protocols. Patients were followed-up for a median of 7/6 years (discovery/validation). MRD values, >1x10⁻⁵, were log transformed with undetectable MRD assigned a value one log below the minimum detection level. Age, MRD and WCC were examined as continuous variables. Good risk genetics (GR-GEN) comprised ETV6-RUNX1 and high hyperdiploidy; while high risk abnormalities (HR-GEN) were KMT2A, haploidy, low hypodiploidy, TCF3-HLF and iAMP21.
Results
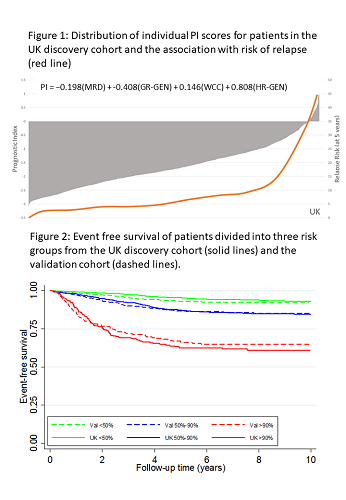
Univariate Cox regression analysis of the discovery cohort revealed 10 risk factors for EFS: sex, age, Down syndrome, WCC, CNS disease, T-ALL, MRD, slow early response, GR-GEN and HR-GEN (each p≤0.002). Boot-strapped multivariate modelling identified a prognostic model comprising MRD, WCC, GR-GEN and HR-GEN. The fit of this model was not improved by adding age nor diminshed in T-ALL. The robustness of the model was assessed using cross-validation techniques and Harrell’s C index was 0.73. Coefficients were used to construct a linear model allowing patient specific PI scores to be calculated (Fig1); revealing a distribution with a mean and SD of -1.62 (0.80). The risk of relapse (RR) correlated with the PI and patients with a PI>0 had a RR>35%. Each unit increase in PI more than doubled RR: hazard ratio 2.74 (95% CI 2.38-3.16), p<0.001. The PI also correlated with time to relapse (p<0.0001). A variety of formal validation methods were used to evaluate the model. The distribution of PI in the validation cohort was similar (mean -1.59, SD 0.79), as was the hazard ratio and C-index (2.18 (1.89-2.51), p<0.001 and 0.69). The validation tests demonstrated that the model accurately predicted outcome for the vast majority of patients. Fig 2 compares the EFS in the two cohorts after segregation into risk groups comprising 50%, 40% and 10% patients. Thus, the model can discriminate risk groups in patient cohorts treated differently. Moreover, it demonstrates the flexibility of a numeric PI to define clinically relevant risk groups of any given size. To compare the prediction accuracy of the PI with traditionally defined risk groups, we assessed the area under the curve (AUC) for each clinical trial. For all 4 trials, the PI was better (higher AUC) at predicting EFS compared with standard risk groups: ALL2003 0.72 v 0.61, p<0.001; NOPHO-ALL2008 0.71 v 0.66, p=0.005; COALL-03 0.71 v 0.51, p<0.001; DOCG-ALL10 0.67 v 0.58, p=0.001.
Conclusion
We have developed and validated a novel PI for predicting outcome in paediatric ALL. The model integrates multiple risk factors using continuous data enabling individual numeric risk scores to be calculated. This model provides an accurate method for predicting outcome and allows greater flexibility for defining treatment group sizes.
Session topic: 2. Acute lymphoblastic leukemia - Clinical
Keyword(s): Acute lymphoblastic leukemia, Chromosomal abnormality, Minimal residual disease (MRD), Prognostic factor
Abstract: S1566
Type: Oral Presentation
Presentation during EHA23: On Sunday, June 17, 2018 from 08:15 - 08:30
Location: Room K1
Background
ALL is heterogeneous in terms of genetics, clinical presentation and therapy response. Risk stratification, based on diagnostic features and early treatment response, has improved outcome. However, current algorithms use risk factors as binary variables which reduces statistical power and fails to account for biological heterogeneity. Moreover, using thresholds results in fixed group sizes which reduces options when designing clinical trials.
Aims
To develop a prognostic index (PI) which (a) integrates genetic, clinical and response data; (b) utilises continuous data; and (c) can be used to define clinically meaningful risk groups.
Methods
The discovery cohort comprised 2,542 UKALL203 patients who achieved a morphological remission. The validation cohort comprised 2,470 patients treated on the COALL-03, DCOG-ALL10 or NOPHO-ALL2008 protocols. Patients were followed-up for a median of 7/6 years (discovery/validation). MRD values, >1x10⁻⁵, were log transformed with undetectable MRD assigned a value one log below the minimum detection level. Age, MRD and WCC were examined as continuous variables. Good risk genetics (GR-GEN) comprised ETV6-RUNX1 and high hyperdiploidy; while high risk abnormalities (HR-GEN) were KMT2A, haploidy, low hypodiploidy, TCF3-HLF and iAMP21.
Results
Univariate Cox regression analysis of the discovery cohort revealed 10 risk factors for EFS: sex, age, Down syndrome, WCC, CNS disease, T-ALL, MRD, slow early response, GR-GEN and HR-GEN (each p≤0.002). Boot-strapped multivariate modelling identified a prognostic model comprising MRD, WCC, GR-GEN and HR-GEN. The fit of this model was not improved by adding age nor diminshed in T-ALL. The robustness of the model was assessed using cross-validation techniques and Harrell’s C index was 0.73. Coefficients were used to construct a linear model allowing patient specific PI scores to be calculated (Fig1); revealing a distribution with a mean and SD of -1.62 (0.80). The risk of relapse (RR) correlated with the PI and patients with a PI>0 had a RR>35%. Each unit increase in PI more than doubled RR: hazard ratio 2.74 (95% CI 2.38-3.16), p<0.001. The PI also correlated with time to relapse (p<0.0001). A variety of formal validation methods were used to evaluate the model. The distribution of PI in the validation cohort was similar (mean -1.59, SD 0.79), as was the hazard ratio and C-index (2.18 (1.89-2.51), p<0.001 and 0.69). The validation tests demonstrated that the model accurately predicted outcome for the vast majority of patients. Fig 2 compares the EFS in the two cohorts after segregation into risk groups comprising 50%, 40% and 10% patients. Thus, the model can discriminate risk groups in patient cohorts treated differently. Moreover, it demonstrates the flexibility of a numeric PI to define clinically relevant risk groups of any given size. To compare the prediction accuracy of the PI with traditionally defined risk groups, we assessed the area under the curve (AUC) for each clinical trial. For all 4 trials, the PI was better (higher AUC) at predicting EFS compared with standard risk groups: ALL2003 0.72 v 0.61, p<0.001; NOPHO-ALL2008 0.71 v 0.66, p=0.005; COALL-03 0.71 v 0.51, p<0.001; DOCG-ALL10 0.67 v 0.58, p=0.001.
Conclusion
We have developed and validated a novel PI for predicting outcome in paediatric ALL. The model integrates multiple risk factors using continuous data enabling individual numeric risk scores to be calculated. This model provides an accurate method for predicting outcome and allows greater flexibility for defining treatment group sizes.
Session topic: 2. Acute lymphoblastic leukemia - Clinical
Keyword(s): Acute lymphoblastic leukemia, Chromosomal abnormality, Minimal residual disease (MRD), Prognostic factor