Abstract: PB1663
Type: Publication Only
Background
Aberrant DNA methylation as well as hydroxymethylation is a hallmark of acute myeloid leukemia (AML). Mutations of DNA methylation regulatory genes (DNMT3A, IDH1, IDH2 and TET2) are present in approximately 40-50 % of AML. These mutations are often present together with the exception of TET2 and IDH1/2 as well as IDH1 and IDH2, which are usually mutually exclusive.
Aims
We aimed to perform DNA methylation, hydroxymethylation and gene expression profiling in clearly defined subgroups of AML patients with distinct mutations in DNA methylation regulatory genes to see whether there is a clear epigenetic and gene expression signature.
Methods
We accomplished DNA hydroxymethylation and methylation profiling in 12 AML samples at diagnosis and in CD34+ cells of 3 healthy controls by MethylationEPIC array (Illumina) covering aprox. 850 000 CpGs. AML samples were chosen based on their mutational status and divided into 4 groups: DNMT3A+ (n=3), IDH1+ (n=3), DNMT3A+/IDH1+ (n=3) and IDH2+ (n=3). The remaining DNA methylation regulatory genes as well as CEBPA were unmutated. 1 μg of genomic DNA was treated with TrueMethyl Seq kit (CEGX) to convert DNA through oxidative bisulfite (oxBS) and bisulfite (BS) treatment. This approach allows us to determine whether CpG is methylated or rather hydroxymethylated. We also performed gene expression profiling on the same samples by HumanHT-12 v4 Expression array (Illumina).
Results
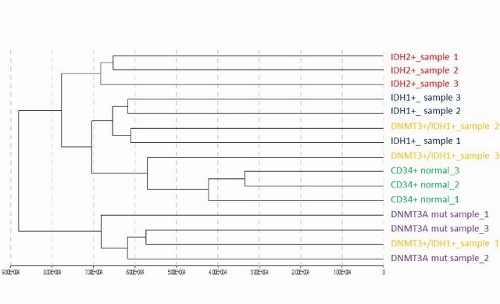
We performed hierarchical clustering analysis of oxBS β-values (corresponding to DNA methylation levels) of 830 304 CpGs (with detection P<0.05) and observed clear separation of 4 groups according to mutational status – DNMT3A+, IDH1+, IDH2+ and CD34+ normals. Interestingly, double positive DNMT3A+IDH1+ (n=3) samples clustered each into different group (DNMT3A+, IDH1+, CD34+ normal) strongly suggesting that there is a cumulative effect of these two opposing mutations (Figure 1). We found out that genes hypermethylated in IDH1+ samples are enriched for genes from HOX gene family (P<0.0001) and that these genes are often hypomethylated in DNMT3A+ patients. In addition, we detected a subgroup of CpGs assigned to HOXA2, HOXA4, HOXA10, HOXB3, HOXC4 and HOXD3 genes that are hypermethylated in IDH1+, hypomethylated in DNMT3A+ and normally methylated in DNMT3+IDH1+ samples relative to CD34+ normals. Clustering of DNA hydroxymethylation values (resulting from subtraction of oxBS β-values from BS β-values) resulted into the same 4 main clusters as shown for DNA methylation data. DNMT3A+ patients displayed the lowest hydroxymethylation levels from all patients. Genes hydroxymethylated in IDH1+ patients were enriched for genes involved JNK cascade (comprising of evolutionarily conserved MAP kinases). The gene expression data did not reveal any cluster coherent with mutational subgroups, only CD34+ normals clustered together.
Conclusion
We explored that AML patients with clearly defined mutational background exhibit distinct DNA methylation as well as hydroxymethylation profiles. The presence of two mutations that have the opposing effect on DNA methylation pattern (DNMT3A and IDH1) is linked to mixed DNA methylation patterns, which prevents unambiguous assignment to one cluster. Further, our data support that IDH1+ and IDH2+ represent distinct biological entities. On the contrary, gene expression profile did not support separation of samples into different mutational subgroups. We plan to enlarge the patients’ cohort and validate the most promising genes involved in selected pathways.
Supported by Ministry of Health of the Czech Republic, grant nr. 15-25809A, and by the project for conceptual development of research organization (00023736) from the Ministry of Health of the Czech Republic.
Session topic: 3. Acute myeloid leukemia - Biology
Keyword(s): Epigenetic, DNA methylation, AML