

Contributions
Abstract: S774
Type: Oral Presentation
Presentation during EHA22: On Sunday, June 25, 2017 from 08:00 - 08:15
Location: Hall C
Background
Published data show 18F-FDG PET-CT (PET) is predictive after first-line immunochemotherapy in advanced-stage symptomatic FL, and PET is now the recommended modality for response assessment. However, no large-scale prospective comparison of the value of standard contrast-enhanced CT vs PET response has been performed.
Aims
To compare CT and PET response assessment for FL pts in the prospective Phase III GALLIUM study, which evaluated chemotherapy plus obinutuzumab (G-chemo) or rituximab (R-chemo) induction followed by maintenance antibody therapy (Marcus 2016).
Methods
PET scans, introduced after an early protocol amendment (July 2011), were performed at baseline and end of induction (EOI; all pts gave informed consent) and assessed by the investigator (INV) and an independent review committee (IRC) comprising two radiologists, with a third adjudicator; final response was determined by a clinician. Response was assessed by CT and PET plus bone marrow biopsy, applying the revised International Working Group (IWG) criteria (Cheson 2007, Juweid 2007). Complete remission (CR) status at EOI for each assessment, CT-CR and PET-CR, was compared with pt characteristics, PFS and OS.
Results
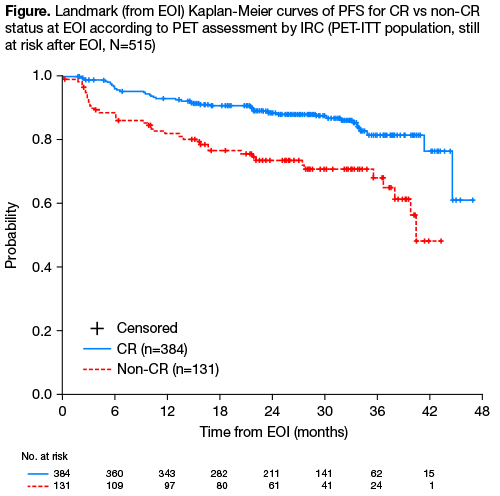
Among 1202 ITT pts with FL enrolled in GALLIUM, IRC-assessed CT showed a CR in 330 pts (27.5%), PR in 747 (62.1%), SD in 20 (1.7%), PD in 35 (2.9%), unavailable (NA) in 48 (4.0%) and unevaluable (NE) in 22 (1.8%). Of 609 pts with a baseline PET scan, 595 had detectable lesions, and 535 also had an evaluable PET at EOI. Baseline demographics and disease characteristics were similar in PET and non-PET populations. Pts with NA (n=52) or NE (n=8) scans were considered non-responders; these pts and those with PD prior to EOI were excluded from landmark PFS analyses. At EOI, 390/595 (65.5%) pts achieved a PET-CR according to IRC, comprising 212/297 (71.4%) G-chemo pts and 178/298 (59.7%) R-chemo pts. However, for these 390 pts, evaluable CT responses were 161 CR (41.3%), 216 PR (55.4%) and 5 SD/PD (1.3%; Table). Conversely, PET assessment showed a PET-CR in 161/177 (91.0%) of pts achieving a CT-CR, and PET-PR in only 117/362 (32.3%) of pts with CT-PR. Concordance between CT and PET assessment was 52.6% for IRC and 54.1% for INV. Concordance between INV and IRC evaluation was 71.9% for CT and 68.6% for PET. After a median follow-up of 34.5 mo (range 0–54.5), IRC-PET status was highly predictive of PFS (PET-CR vs PET non-CR: HR 0.39; 95% CI 0.25–0.60; p<0.0001) and OS (HR 0.41; 95% CI 0.19–0.86; p=0.018). 2.5-yr PFS from EOI was 87.6% (95% CI 83.5–90.8) for PET-CR pts compared with 70.9% (95% CI 61.3–78.6) for PET non-CR pts; corresponding OS was 96.6% (95% CI 94.1–98.1) vs 90.9% (95% CI 84.7–94.6).
Table: CT and PET clinical response assessment by IRC at EOI | ||||||
PET, n (%) | CT, n (%) | |||||
CR | PR | SD | PD | NE | NA | |
CR | 161 (27.1) | 216 (36.3) | 4 (0.7) | 1 (0.2) | 7 (1.2) | 1 (0.2) |
PR | 7 (1.2) | 117 (19.7) | 1 (0.2) | 1 (0.2) | 1 (0.2) | |
SD | 4 (0.7) | |||||
PD | 2 (0.3) | 3 (0.5) | 1 (0.2) | 8 (1.3) | ||
NE | 2 (0.3) | 1 (0.2) | 5 (0.8) | |||
NA | 5 (0.8) | 25 (4.2) | 1 (0.2) | 2 (0.3) | 1 (0.2) | 18 (3.0) |
Conclusion
This large prospective analysis confirms EOI PET as an early predictor of PFS and OS in FL, with good concordance between INV and IRC PET evaluation. Comparison of PFS based on CT-response and re-analysis of PET scans applying the now recommended 5-point scale for PET response assessment will be presented. Pooled analyses of these and data from other studies with longer follow-up may determine PET response as a reliable early surrogate for PFS and OS, providing a platform for study of response-adapted therapy.
Session topic: 19. Indolent Non-Hodgkin lymphoma - Clinical
Keyword(s): Prognostic factor, Positron emission tomography (PET), Immunotherapy, Follicular lymphoma
Abstract: S774
Type: Oral Presentation
Presentation during EHA22: On Sunday, June 25, 2017 from 08:00 - 08:15
Location: Hall C
Background
Published data show 18F-FDG PET-CT (PET) is predictive after first-line immunochemotherapy in advanced-stage symptomatic FL, and PET is now the recommended modality for response assessment. However, no large-scale prospective comparison of the value of standard contrast-enhanced CT vs PET response has been performed.
Aims
To compare CT and PET response assessment for FL pts in the prospective Phase III GALLIUM study, which evaluated chemotherapy plus obinutuzumab (G-chemo) or rituximab (R-chemo) induction followed by maintenance antibody therapy (Marcus 2016).
Methods
PET scans, introduced after an early protocol amendment (July 2011), were performed at baseline and end of induction (EOI; all pts gave informed consent) and assessed by the investigator (INV) and an independent review committee (IRC) comprising two radiologists, with a third adjudicator; final response was determined by a clinician. Response was assessed by CT and PET plus bone marrow biopsy, applying the revised International Working Group (IWG) criteria (Cheson 2007, Juweid 2007). Complete remission (CR) status at EOI for each assessment, CT-CR and PET-CR, was compared with pt characteristics, PFS and OS.
Results
Among 1202 ITT pts with FL enrolled in GALLIUM, IRC-assessed CT showed a CR in 330 pts (27.5%), PR in 747 (62.1%), SD in 20 (1.7%), PD in 35 (2.9%), unavailable (NA) in 48 (4.0%) and unevaluable (NE) in 22 (1.8%). Of 609 pts with a baseline PET scan, 595 had detectable lesions, and 535 also had an evaluable PET at EOI. Baseline demographics and disease characteristics were similar in PET and non-PET populations. Pts with NA (n=52) or NE (n=8) scans were considered non-responders; these pts and those with PD prior to EOI were excluded from landmark PFS analyses. At EOI, 390/595 (65.5%) pts achieved a PET-CR according to IRC, comprising 212/297 (71.4%) G-chemo pts and 178/298 (59.7%) R-chemo pts. However, for these 390 pts, evaluable CT responses were 161 CR (41.3%), 216 PR (55.4%) and 5 SD/PD (1.3%; Table). Conversely, PET assessment showed a PET-CR in 161/177 (91.0%) of pts achieving a CT-CR, and PET-PR in only 117/362 (32.3%) of pts with CT-PR. Concordance between CT and PET assessment was 52.6% for IRC and 54.1% for INV. Concordance between INV and IRC evaluation was 71.9% for CT and 68.6% for PET. After a median follow-up of 34.5 mo (range 0–54.5), IRC-PET status was highly predictive of PFS (PET-CR vs PET non-CR: HR 0.39; 95% CI 0.25–0.60; p<0.0001) and OS (HR 0.41; 95% CI 0.19–0.86; p=0.018). 2.5-yr PFS from EOI was 87.6% (95% CI 83.5–90.8) for PET-CR pts compared with 70.9% (95% CI 61.3–78.6) for PET non-CR pts; corresponding OS was 96.6% (95% CI 94.1–98.1) vs 90.9% (95% CI 84.7–94.6).
Table: CT and PET clinical response assessment by IRC at EOI | ||||||
PET, n (%) | CT, n (%) | |||||
CR | PR | SD | PD | NE | NA | |
CR | 161 (27.1) | 216 (36.3) | 4 (0.7) | 1 (0.2) | 7 (1.2) | 1 (0.2) |
PR | 7 (1.2) | 117 (19.7) | 1 (0.2) | 1 (0.2) | 1 (0.2) | |
SD | 4 (0.7) | |||||
PD | 2 (0.3) | 3 (0.5) | 1 (0.2) | 8 (1.3) | ||
NE | 2 (0.3) | 1 (0.2) | 5 (0.8) | |||
NA | 5 (0.8) | 25 (4.2) | 1 (0.2) | 2 (0.3) | 1 (0.2) | 18 (3.0) |
Conclusion
This large prospective analysis confirms EOI PET as an early predictor of PFS and OS in FL, with good concordance between INV and IRC PET evaluation. Comparison of PFS based on CT-response and re-analysis of PET scans applying the now recommended 5-point scale for PET response assessment will be presented. Pooled analyses of these and data from other studies with longer follow-up may determine PET response as a reliable early surrogate for PFS and OS, providing a platform for study of response-adapted therapy.
Session topic: 19. Indolent Non-Hodgkin lymphoma - Clinical
Keyword(s): Prognostic factor, Positron emission tomography (PET), Immunotherapy, Follicular lymphoma