
IMPACT OF SPLENOMEGALY ON MPN SYMPTOMS AND ASSOCIATION WITH CLINICAL FEATURES: AN ANALYSIS BY THE MPN QUALITY OF LIFE INTERNATIONAL STUDY GROUP
(Abstract release date: 05/19/16)
EHA Library. Geyer H. 06/09/16; 132888; E1339

Dr. Holly L Geyer
Contributions
Contributions
Abstract
Abstract: E1339
Type: Eposter Presentation
Background
Splenomegaly (SM) is frequently observed in Myeloproliferative Neoplasms (MPNs). Many MPN symptoms have been attributed to splenomegaly but studies exploring these associations are lacking.
Aims
We sought to evaluate how the presence of severe splenomegaly (>10cm below costal margin [BCM]) impacts patient symptomatology and relates to other clinical features.
Methods
Data was collected among an international cohort of MPN patients including polycythemia vera (PV), essential thrombocythemia (ET) and myelofibrosis (MF) without splenectomy as reported previously (Emanuel et al., JCO 2013). Subjects completed BFI and MPN-SAF instruments. Items were scored on a 0 (absent) to 10 (worst imaginable) scale. For individuals completing at least 6 of the 10 MPN-SAF TSS items, the survey was scored by multiplying the average score across items by 10 to achieve a 0 to 100 scaled score. Demographics, clinical features and symptom scores were compared between splenomegaly subgroups using ANOVA F-tests or chi-squared tests. Splenomegaly was assessed by clinicians based on physical examination and reported as an estimated value BCM. Patients were categorized into ‘No-SM’ (non-palpable), ‘Mild-SM’ (1-10cm) and ‘Severe-SM' (>10cm).
Results
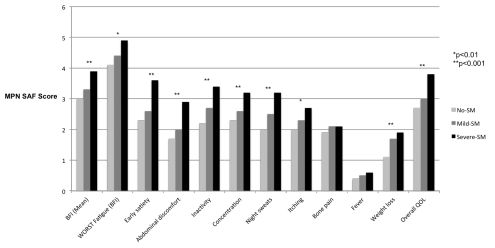
Demographics: A total of 2043 patients were included in the analysis (No-SM, n=1462; Mild-SM, n=404; Severe-SM, n=177) with a mean spleen size of 2.6 cm BCM (range 10.1-31.0 cm). Patients were of expected age (59.7 years) and similar gender distribution (54.6% female). MPN subtypes included ET (41.9%), PV (35.2%) and MF (22.9%). The most prevalent prognostic risk group for each subtype was as follows: ET, intermediate (46.1%); MF, Int.-1 (54.9%); PV, High (49.2%). Compared to a history of prior thrombosis (20.3%), anemia (8.7%), leukopenia (9.9%), thrombocytopenia (11.0%), red blood cell transfusions (5.8%) and prior hemorrhage (5.0%) were relatively uncommon.Clinical Correlations: When compared to No-SM populations, patients with Severe-SM were most likely to be >60 years (54.5% vs. 45.5%, p=0.015) and have MF (62.7% vs. 10.8%, [p<0.001]). Severe-SM patients were also most likely to suffer from anemia (29.3% vs. 4.0%), leukopenia (16.4% vs. 7.5%) and thrombocytopenia (34.2% vs. 7.1%, all p<0.001), along with prior hemorrhages (8% vs. 4.2%, p=0.029) and have the highest transfusion requirements (15.3% vs. 2.8%, p<0.001). In contrast, No-SM patients were most likely to have a history of prior thrombosis (20.1% vs. 14.3%, p=0.046). SM did not correlate with gender or individual prognostic risk categories.Symptoms: Severe-SM was associated with the highest Total Symptom Scores (TSS, 28.5 vs. 16.3 in No-SM, p<0.001) and individual symptom scores for all items assessed, with the exception of fever and bone pain (both p>0.05; Figure 1). Highest scores were noted for fatigue (4.9 vs. 4.1, p=0.006), early satiety (3.6 vs. 2.3, p<0.001), inactivity (3.4 vs. 2.2, p<0.001), and impact on overall quality of life (3.8 vs. 2.7, p<0.001). Abdominal discomfort (2.9 vs. 1.7, p<0.001) and weight loss (1.9 vs. 1.1, p<0.001) scores were of relatively low severity in comparison to other complaints.
Conclusion
Spleen size directly correlates with symptoms unrelated to the abdominal cavity and overall MPN disease burden. The lack of association between spleen size and prognostic risk scores suggests low risk patients may still suffer from significant, undermanaged symptomatology.
Session topic: E-poster
Keyword(s): Essential Thrombocytemia, Myelofibrosis, Myeloproliferative disorder, Polycythemia vera
Type: Eposter Presentation
Background
Splenomegaly (SM) is frequently observed in Myeloproliferative Neoplasms (MPNs). Many MPN symptoms have been attributed to splenomegaly but studies exploring these associations are lacking.
Aims
We sought to evaluate how the presence of severe splenomegaly (>10cm below costal margin [BCM]) impacts patient symptomatology and relates to other clinical features.
Methods
Data was collected among an international cohort of MPN patients including polycythemia vera (PV), essential thrombocythemia (ET) and myelofibrosis (MF) without splenectomy as reported previously (Emanuel et al., JCO 2013). Subjects completed BFI and MPN-SAF instruments. Items were scored on a 0 (absent) to 10 (worst imaginable) scale. For individuals completing at least 6 of the 10 MPN-SAF TSS items, the survey was scored by multiplying the average score across items by 10 to achieve a 0 to 100 scaled score. Demographics, clinical features and symptom scores were compared between splenomegaly subgroups using ANOVA F-tests or chi-squared tests. Splenomegaly was assessed by clinicians based on physical examination and reported as an estimated value BCM. Patients were categorized into ‘No-SM’ (non-palpable), ‘Mild-SM’ (1-10cm) and ‘Severe-SM' (>10cm).
Results
Demographics: A total of 2043 patients were included in the analysis (No-SM, n=1462; Mild-SM, n=404; Severe-SM, n=177) with a mean spleen size of 2.6 cm BCM (range 10.1-31.0 cm). Patients were of expected age (59.7 years) and similar gender distribution (54.6% female). MPN subtypes included ET (41.9%), PV (35.2%) and MF (22.9%). The most prevalent prognostic risk group for each subtype was as follows: ET, intermediate (46.1%); MF, Int.-1 (54.9%); PV, High (49.2%). Compared to a history of prior thrombosis (20.3%), anemia (8.7%), leukopenia (9.9%), thrombocytopenia (11.0%), red blood cell transfusions (5.8%) and prior hemorrhage (5.0%) were relatively uncommon.Clinical Correlations: When compared to No-SM populations, patients with Severe-SM were most likely to be >60 years (54.5% vs. 45.5%, p=0.015) and have MF (62.7% vs. 10.8%, [p<0.001]). Severe-SM patients were also most likely to suffer from anemia (29.3% vs. 4.0%), leukopenia (16.4% vs. 7.5%) and thrombocytopenia (34.2% vs. 7.1%, all p<0.001), along with prior hemorrhages (8% vs. 4.2%, p=0.029) and have the highest transfusion requirements (15.3% vs. 2.8%, p<0.001). In contrast, No-SM patients were most likely to have a history of prior thrombosis (20.1% vs. 14.3%, p=0.046). SM did not correlate with gender or individual prognostic risk categories.Symptoms: Severe-SM was associated with the highest Total Symptom Scores (TSS, 28.5 vs. 16.3 in No-SM, p<0.001) and individual symptom scores for all items assessed, with the exception of fever and bone pain (both p>0.05; Figure 1). Highest scores were noted for fatigue (4.9 vs. 4.1, p=0.006), early satiety (3.6 vs. 2.3, p<0.001), inactivity (3.4 vs. 2.2, p<0.001), and impact on overall quality of life (3.8 vs. 2.7, p<0.001). Abdominal discomfort (2.9 vs. 1.7, p<0.001) and weight loss (1.9 vs. 1.1, p<0.001) scores were of relatively low severity in comparison to other complaints.
Conclusion
Spleen size directly correlates with symptoms unrelated to the abdominal cavity and overall MPN disease burden. The lack of association between spleen size and prognostic risk scores suggests low risk patients may still suffer from significant, undermanaged symptomatology.
Session topic: E-poster
Keyword(s): Essential Thrombocytemia, Myelofibrosis, Myeloproliferative disorder, Polycythemia vera
Abstract: E1339
Type: Eposter Presentation
Background
Splenomegaly (SM) is frequently observed in Myeloproliferative Neoplasms (MPNs). Many MPN symptoms have been attributed to splenomegaly but studies exploring these associations are lacking.
Aims
We sought to evaluate how the presence of severe splenomegaly (>10cm below costal margin [BCM]) impacts patient symptomatology and relates to other clinical features.
Methods
Data was collected among an international cohort of MPN patients including polycythemia vera (PV), essential thrombocythemia (ET) and myelofibrosis (MF) without splenectomy as reported previously (Emanuel et al., JCO 2013). Subjects completed BFI and MPN-SAF instruments. Items were scored on a 0 (absent) to 10 (worst imaginable) scale. For individuals completing at least 6 of the 10 MPN-SAF TSS items, the survey was scored by multiplying the average score across items by 10 to achieve a 0 to 100 scaled score. Demographics, clinical features and symptom scores were compared between splenomegaly subgroups using ANOVA F-tests or chi-squared tests. Splenomegaly was assessed by clinicians based on physical examination and reported as an estimated value BCM. Patients were categorized into ‘No-SM’ (non-palpable), ‘Mild-SM’ (1-10cm) and ‘Severe-SM' (>10cm).
Results
Demographics: A total of 2043 patients were included in the analysis (No-SM, n=1462; Mild-SM, n=404; Severe-SM, n=177) with a mean spleen size of 2.6 cm BCM (range 10.1-31.0 cm). Patients were of expected age (59.7 years) and similar gender distribution (54.6% female). MPN subtypes included ET (41.9%), PV (35.2%) and MF (22.9%). The most prevalent prognostic risk group for each subtype was as follows: ET, intermediate (46.1%); MF, Int.-1 (54.9%); PV, High (49.2%). Compared to a history of prior thrombosis (20.3%), anemia (8.7%), leukopenia (9.9%), thrombocytopenia (11.0%), red blood cell transfusions (5.8%) and prior hemorrhage (5.0%) were relatively uncommon.Clinical Correlations: When compared to No-SM populations, patients with Severe-SM were most likely to be >60 years (54.5% vs. 45.5%, p=0.015) and have MF (62.7% vs. 10.8%, [p<0.001]). Severe-SM patients were also most likely to suffer from anemia (29.3% vs. 4.0%), leukopenia (16.4% vs. 7.5%) and thrombocytopenia (34.2% vs. 7.1%, all p<0.001), along with prior hemorrhages (8% vs. 4.2%, p=0.029) and have the highest transfusion requirements (15.3% vs. 2.8%, p<0.001). In contrast, No-SM patients were most likely to have a history of prior thrombosis (20.1% vs. 14.3%, p=0.046). SM did not correlate with gender or individual prognostic risk categories.Symptoms: Severe-SM was associated with the highest Total Symptom Scores (TSS, 28.5 vs. 16.3 in No-SM, p<0.001) and individual symptom scores for all items assessed, with the exception of fever and bone pain (both p>0.05; Figure 1). Highest scores were noted for fatigue (4.9 vs. 4.1, p=0.006), early satiety (3.6 vs. 2.3, p<0.001), inactivity (3.4 vs. 2.2, p<0.001), and impact on overall quality of life (3.8 vs. 2.7, p<0.001). Abdominal discomfort (2.9 vs. 1.7, p<0.001) and weight loss (1.9 vs. 1.1, p<0.001) scores were of relatively low severity in comparison to other complaints.
Conclusion
Spleen size directly correlates with symptoms unrelated to the abdominal cavity and overall MPN disease burden. The lack of association between spleen size and prognostic risk scores suggests low risk patients may still suffer from significant, undermanaged symptomatology.
Session topic: E-poster
Keyword(s): Essential Thrombocytemia, Myelofibrosis, Myeloproliferative disorder, Polycythemia vera
{{ help_message }}
{{filter}}