
SURVIVAL AND TREATMENT PATTERNS IN PATIENTS WITH SYMPTOMATIC MULTIPLE MYELOMA (MM) IN A REAL-WORLD SETTING
(Abstract release date: 05/19/16)
EHA Library. Hájek R. 06/09/16; 132829; E1280

Prof. Roman Hájek
Contributions
Contributions
Abstract
Abstract: E1280
Type: Eposter Presentation
Background
Survival rates for patients (pts) with MM have improved with the advent of new therapies, however data on real-world survival outcomes are limited.
Aims
Retrospective analysis using the Registry of Monoclonal Gammopathies database of the Czech Myeloma Group.
Methods
Pts diagnosed with symptomatic MM (May 2007–June 2014), were followed from diagnosis until death, loss to follow-up or June 2015. The primary analysis was to estimate overall survival (OS) from diagnosis; secondary analyses included treatment-line-specific OS and progression-free survival (PFS), treatment patterns and response. Exploratory analyses included OS and PFS from treatment initiation by International Staging System (ISS) stage, International Myeloma Working Group (IMWG) risk and therapy type (lenalidomide plus dexamethasone [Ld] or bortezomib [bor]-based regimens).
Results
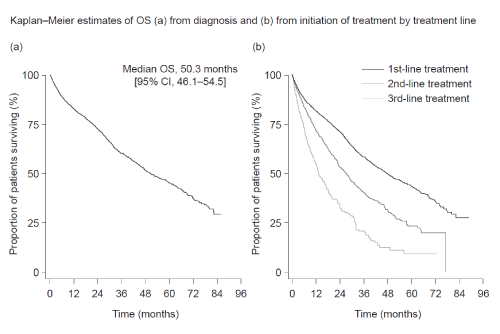
2513 pts were included. Median age at diagnosis was 67.0 years. Similar proportions of pts had ISS stage I, II or III disease. Median OS (months, 95% confidence interval [CI]) from diagnosis was 50.3 (46.1–54.5) and decreased from 47.5 (43.1–52.0) at 1st line to 13.2 (11.3–15.2) at 3rd (Figure). Median PFS (months, 95% CI) decreased from 16.3 (15.4–17.2) at 1st line to 6.0 (5.4–6.6) at 3rd. Main treatments at 1st line (n=2446) were bor- (46%) or thalidomide-based (40%). At subsequent lines, pts frequently received bor - or lenalidomide-based regimens (2nd line [n=1118], 49% and 31%; 3rd line [n=547], 26% and 47%, respectively). Overall response rates decreased across lines: 58% at 1st line, decreasing to 44% and 28% at 2nd and 3rd lines. Differences in median OS and PFS by treatment line were observed according to ISS stage and IMWG risk (Table). An analysis of pts (excluding those in clinical trials) receiving Ld 2nd to 4th line, showed median OS decreased at each subsequent line (2nd line 26.2 [21.7–30.8] and 3rd line 12.6 [11.4–13.7]), comparable to median OS in all patients. Median PFS was 7.5 (6.3–8.8); values at 2nd and 3rd lines were 8.7 (7.3–10.1) and 6.6 (5.3–8.0). Similar trends were seen in pts (excluding those in clinical trials) receiving bor in 2nd to 4th lines. At 2nd and 3rd lines, median OS values were 27.3 (22.7–31.8) and 16.2 (12.1–20.3); median PFS values were 11.3 (9.9–12.6) and 5.7 (4.7–6.8).
Conclusion
Real-world outcomes in pts with symptomatic MM are considerably lower than those reported in clinical trials. OS and PFS decreased significantly with each successive treatment line. Despite availability of novel agents, MM remains a disease with high unmet need.
Session topic: E-poster
Keyword(s): Multiple myeloma
Type: Eposter Presentation
Background
Survival rates for patients (pts) with MM have improved with the advent of new therapies, however data on real-world survival outcomes are limited.
Aims
Retrospective analysis using the Registry of Monoclonal Gammopathies database of the Czech Myeloma Group.
Methods
Pts diagnosed with symptomatic MM (May 2007–June 2014), were followed from diagnosis until death, loss to follow-up or June 2015. The primary analysis was to estimate overall survival (OS) from diagnosis; secondary analyses included treatment-line-specific OS and progression-free survival (PFS), treatment patterns and response. Exploratory analyses included OS and PFS from treatment initiation by International Staging System (ISS) stage, International Myeloma Working Group (IMWG) risk and therapy type (lenalidomide plus dexamethasone [Ld] or bortezomib [bor]-based regimens).
Results
2513 pts were included. Median age at diagnosis was 67.0 years. Similar proportions of pts had ISS stage I, II or III disease. Median OS (months, 95% confidence interval [CI]) from diagnosis was 50.3 (46.1–54.5) and decreased from 47.5 (43.1–52.0) at 1st line to 13.2 (11.3–15.2) at 3rd (Figure). Median PFS (months, 95% CI) decreased from 16.3 (15.4–17.2) at 1st line to 6.0 (5.4–6.6) at 3rd. Main treatments at 1st line (n=2446) were bor- (46%) or thalidomide-based (40%). At subsequent lines, pts frequently received bor - or lenalidomide-based regimens (2nd line [n=1118], 49% and 31%; 3rd line [n=547], 26% and 47%, respectively). Overall response rates decreased across lines: 58% at 1st line, decreasing to 44% and 28% at 2nd and 3rd lines. Differences in median OS and PFS by treatment line were observed according to ISS stage and IMWG risk (Table). An analysis of pts (excluding those in clinical trials) receiving Ld 2nd to 4th line, showed median OS decreased at each subsequent line (2nd line 26.2 [21.7–30.8] and 3rd line 12.6 [11.4–13.7]), comparable to median OS in all patients. Median PFS was 7.5 (6.3–8.8); values at 2nd and 3rd lines were 8.7 (7.3–10.1) and 6.6 (5.3–8.0). Similar trends were seen in pts (excluding those in clinical trials) receiving bor in 2nd to 4th lines. At 2nd and 3rd lines, median OS values were 27.3 (22.7–31.8) and 16.2 (12.1–20.3); median PFS values were 11.3 (9.9–12.6) and 5.7 (4.7–6.8).
| Line | ISS Stage I | ISS Stage II | ISS Stage III | IMWG Risk Low | IMWG Risk standard | IMWG Risk High |
| Median OS, months (95% CI) | ||||||
| First | 82.1 (Not Estimable) | 46.9 (40.3–53.5) | 29.9 (26.9–32.9) | Not reached | 50.6 (40.6-60.6) | 31.8 (27.1-36.5) |
| Second | 46.7 (31.4–62.0) | 28.6 (24.7–32.5) | 19.3 (16.5–22.1) | 57.3 (19.3-95.3) | 35.5 (26.9-44.1) | 14.9 (5.6-24.2) |
| Third | 19.6 (14.2–25.0) | 13.7 (10.9–16.4) | 10.0 (7.6–12.4) | 24.8 (14.7-35.0) | 19.8 (14.5-25.2) | 7.6 (3.3-11.9) |
| Median PFS, months (95% CI) | ||||||
| First | 23.2 (21.1–25.3) | 17.2 (15.9–18.6) | 11.6 (10.2–12.9) | 37.5 (20.6-54.4) | 17.3 (14.7-19.9) | 14.2 (11.5-16.9) |
| Second | 13.3 (12.2–14.5) | 11.0 (9.6–12.4) | 8.6 (7.4–9.9) | 21.6 (5.9-37.3) | 12.0 (9.7-14.2) | 7.0 (5.0-9.0) |
| Third | 7.3 (6.1–8.6) | 5.7 (4.9–6.6) | 5.5 (4.5–6.4) | 5.9 (5.6-6.1) | 7.1 (4.8-9.4) | 4.4 (3.2-5.5) |
Conclusion
Real-world outcomes in pts with symptomatic MM are considerably lower than those reported in clinical trials. OS and PFS decreased significantly with each successive treatment line. Despite availability of novel agents, MM remains a disease with high unmet need.
Session topic: E-poster
Keyword(s): Multiple myeloma
Abstract: E1280
Type: Eposter Presentation
Background
Survival rates for patients (pts) with MM have improved with the advent of new therapies, however data on real-world survival outcomes are limited.
Aims
Retrospective analysis using the Registry of Monoclonal Gammopathies database of the Czech Myeloma Group.
Methods
Pts diagnosed with symptomatic MM (May 2007–June 2014), were followed from diagnosis until death, loss to follow-up or June 2015. The primary analysis was to estimate overall survival (OS) from diagnosis; secondary analyses included treatment-line-specific OS and progression-free survival (PFS), treatment patterns and response. Exploratory analyses included OS and PFS from treatment initiation by International Staging System (ISS) stage, International Myeloma Working Group (IMWG) risk and therapy type (lenalidomide plus dexamethasone [Ld] or bortezomib [bor]-based regimens).
Results
2513 pts were included. Median age at diagnosis was 67.0 years. Similar proportions of pts had ISS stage I, II or III disease. Median OS (months, 95% confidence interval [CI]) from diagnosis was 50.3 (46.1–54.5) and decreased from 47.5 (43.1–52.0) at 1st line to 13.2 (11.3–15.2) at 3rd (Figure). Median PFS (months, 95% CI) decreased from 16.3 (15.4–17.2) at 1st line to 6.0 (5.4–6.6) at 3rd. Main treatments at 1st line (n=2446) were bor- (46%) or thalidomide-based (40%). At subsequent lines, pts frequently received bor - or lenalidomide-based regimens (2nd line [n=1118], 49% and 31%; 3rd line [n=547], 26% and 47%, respectively). Overall response rates decreased across lines: 58% at 1st line, decreasing to 44% and 28% at 2nd and 3rd lines. Differences in median OS and PFS by treatment line were observed according to ISS stage and IMWG risk (Table). An analysis of pts (excluding those in clinical trials) receiving Ld 2nd to 4th line, showed median OS decreased at each subsequent line (2nd line 26.2 [21.7–30.8] and 3rd line 12.6 [11.4–13.7]), comparable to median OS in all patients. Median PFS was 7.5 (6.3–8.8); values at 2nd and 3rd lines were 8.7 (7.3–10.1) and 6.6 (5.3–8.0). Similar trends were seen in pts (excluding those in clinical trials) receiving bor in 2nd to 4th lines. At 2nd and 3rd lines, median OS values were 27.3 (22.7–31.8) and 16.2 (12.1–20.3); median PFS values were 11.3 (9.9–12.6) and 5.7 (4.7–6.8).
Conclusion
Real-world outcomes in pts with symptomatic MM are considerably lower than those reported in clinical trials. OS and PFS decreased significantly with each successive treatment line. Despite availability of novel agents, MM remains a disease with high unmet need.
Session topic: E-poster
Keyword(s): Multiple myeloma
Type: Eposter Presentation
Background
Survival rates for patients (pts) with MM have improved with the advent of new therapies, however data on real-world survival outcomes are limited.
Aims
Retrospective analysis using the Registry of Monoclonal Gammopathies database of the Czech Myeloma Group.
Methods
Pts diagnosed with symptomatic MM (May 2007–June 2014), were followed from diagnosis until death, loss to follow-up or June 2015. The primary analysis was to estimate overall survival (OS) from diagnosis; secondary analyses included treatment-line-specific OS and progression-free survival (PFS), treatment patterns and response. Exploratory analyses included OS and PFS from treatment initiation by International Staging System (ISS) stage, International Myeloma Working Group (IMWG) risk and therapy type (lenalidomide plus dexamethasone [Ld] or bortezomib [bor]-based regimens).
Results
2513 pts were included. Median age at diagnosis was 67.0 years. Similar proportions of pts had ISS stage I, II or III disease. Median OS (months, 95% confidence interval [CI]) from diagnosis was 50.3 (46.1–54.5) and decreased from 47.5 (43.1–52.0) at 1st line to 13.2 (11.3–15.2) at 3rd (Figure). Median PFS (months, 95% CI) decreased from 16.3 (15.4–17.2) at 1st line to 6.0 (5.4–6.6) at 3rd. Main treatments at 1st line (n=2446) were bor- (46%) or thalidomide-based (40%). At subsequent lines, pts frequently received bor - or lenalidomide-based regimens (2nd line [n=1118], 49% and 31%; 3rd line [n=547], 26% and 47%, respectively). Overall response rates decreased across lines: 58% at 1st line, decreasing to 44% and 28% at 2nd and 3rd lines. Differences in median OS and PFS by treatment line were observed according to ISS stage and IMWG risk (Table). An analysis of pts (excluding those in clinical trials) receiving Ld 2nd to 4th line, showed median OS decreased at each subsequent line (2nd line 26.2 [21.7–30.8] and 3rd line 12.6 [11.4–13.7]), comparable to median OS in all patients. Median PFS was 7.5 (6.3–8.8); values at 2nd and 3rd lines were 8.7 (7.3–10.1) and 6.6 (5.3–8.0). Similar trends were seen in pts (excluding those in clinical trials) receiving bor in 2nd to 4th lines. At 2nd and 3rd lines, median OS values were 27.3 (22.7–31.8) and 16.2 (12.1–20.3); median PFS values were 11.3 (9.9–12.6) and 5.7 (4.7–6.8).
| Line | ISS Stage I | ISS Stage II | ISS Stage III | IMWG Risk Low | IMWG Risk standard | IMWG Risk High |
| Median OS, months (95% CI) | ||||||
| First | 82.1 (Not Estimable) | 46.9 (40.3–53.5) | 29.9 (26.9–32.9) | Not reached | 50.6 (40.6-60.6) | 31.8 (27.1-36.5) |
| Second | 46.7 (31.4–62.0) | 28.6 (24.7–32.5) | 19.3 (16.5–22.1) | 57.3 (19.3-95.3) | 35.5 (26.9-44.1) | 14.9 (5.6-24.2) |
| Third | 19.6 (14.2–25.0) | 13.7 (10.9–16.4) | 10.0 (7.6–12.4) | 24.8 (14.7-35.0) | 19.8 (14.5-25.2) | 7.6 (3.3-11.9) |
| Median PFS, months (95% CI) | ||||||
| First | 23.2 (21.1–25.3) | 17.2 (15.9–18.6) | 11.6 (10.2–12.9) | 37.5 (20.6-54.4) | 17.3 (14.7-19.9) | 14.2 (11.5-16.9) |
| Second | 13.3 (12.2–14.5) | 11.0 (9.6–12.4) | 8.6 (7.4–9.9) | 21.6 (5.9-37.3) | 12.0 (9.7-14.2) | 7.0 (5.0-9.0) |
| Third | 7.3 (6.1–8.6) | 5.7 (4.9–6.6) | 5.5 (4.5–6.4) | 5.9 (5.6-6.1) | 7.1 (4.8-9.4) | 4.4 (3.2-5.5) |
Conclusion
Real-world outcomes in pts with symptomatic MM are considerably lower than those reported in clinical trials. OS and PFS decreased significantly with each successive treatment line. Despite availability of novel agents, MM remains a disease with high unmet need.
Session topic: E-poster
Keyword(s): Multiple myeloma
{{ help_message }}
{{filter}}