
ROBUSTNESS OF THE PROGNOSTIC VALUE OF THE SKY92 MARKER VERSUS FISH MARKERS ACROSS NINE MULTIPLE MYELOMA COHORTS
(Abstract release date: 05/19/16)
EHA Library. van Vliet M. 06/09/16; 132811; E1262

Dr. Martin van Vliet
Contributions
Contributions
Abstract
Abstract: E1262
Type: Eposter Presentation
Background
Multiple Myeloma (MM) is recognized as a heterogeneous group of patients with varying response and outcome of their disease, associated with various risk factors including genetic aberrations. With increasing availability of genetic data, ever more reliable conclusions can be drawn about the relevance of individual and combined biomarkers. Here we compare multiple stratifications of MM to evaluate their value in relation to overall survival (OS). All available biomarkers were used and included interphase FISH (iFISH), virtual FISH (vFISH), SKY92, ISS and some combinations thereof. The other combination is SKY92 + ISS recently identified to be superior to all other combinations of one or two biomarkers for identification of both high risk and low risk patients.
Aims
To demonstrate and compare the robustness of the prognostic value of the SKY92, ISS, SKY92 + ISS and various FISH marker risk classification methods across a wide variety of clinical datasets including NDMM and RRMM, young/elderly patients and a wide diversity of treatments.
Methods
Nine GEP datasets publicly available or obtained by analysis of the CE IVD MMprofiler assay were used (Table 1, rows) and evaluated for 17 biomarkers (Table 1, columns). In each analysis the Cox proportional hazard ratio (HR) and its p-value are calculated. Interphase FISH (iFISH) data was not available for all datasets, therefore, the so-called Virtual FISH markers (as classified by GEP signatures with high accuracy) were determined using the MMprofiler assay algorithms. Note that there is no virtual FISH signature for del(17p). We combined the subtypes [t(14;16) + t(14;20)] since they are rare but both predictors of poor outcome.
Results
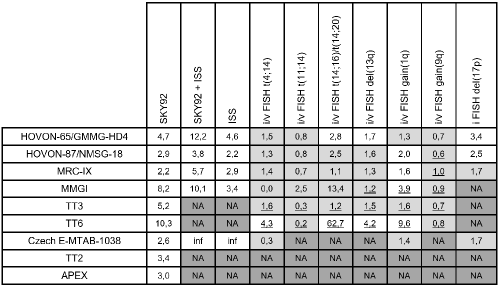
All available data was used to compare prognostic HR and p-values for overall survival in nine MM cohorts, see Table 1. Note that HOVON-65/GMMG-HD4 was the training set for SKY92. iFISH data was only available for a limited set of studies. Therefore, additionally, vFISH results are shown (HR in white). For some of the datasets, the microarray platform was not HG-U133Plus2 - for which the MMprofiler vFISH software was developed - such that no vFISH call was available. There was also missing ISS data for 4 study cohorts. SKY92 could be determined in all datasets and was always prognostic (Table 1, white across the column). ISS and the combination of ISS + SKY92 could be determined in 5 datasets and were significant in all 5 of the studies. The FISH markers did not show robust prognostic values across the evaluated datasets. Only gain(1q) showed prognostic value in 4 out of 6 datasets. Hazard ratios are given in Table 1 and cell-shading is white where p-values were significant (<0.05).Table 1. Prognostic value (hazard ratios for OS) of ISS and genetic biomarkers in nine clinical datasets including NDMM and RRMM. White = significant (p<0.05); grey = n.s.; dark grey = NA / not available. 1) HOVON-65/ GMMG-HD4 |n=329|, 2) HOVON-87/NMSG-18 |n=143|, 3) MRC-IX |n=246|, 4) MMGI |n=91|, 5) TT3 |n=139|, 6) TT6 |n=55|, 7) Czech E-MTAB-1038 |n=66|, 8) TT2 |n=351|, 9) APEX |n=264|. FISH column HR with underscores are based on vFISH, others on iFISH. Inf = infinitely large.
Conclusion
SKY92, and its combination with ISS, have demonstrated to be robust prognostic markers in MM while the evaluated FISH markers do not show robustness for prognostic purposes.
Session topic: E-poster
Keyword(s): FISH, Gene expression profile, Multiple myeloma, Prognostic factor
Type: Eposter Presentation
Background
Multiple Myeloma (MM) is recognized as a heterogeneous group of patients with varying response and outcome of their disease, associated with various risk factors including genetic aberrations. With increasing availability of genetic data, ever more reliable conclusions can be drawn about the relevance of individual and combined biomarkers. Here we compare multiple stratifications of MM to evaluate their value in relation to overall survival (OS). All available biomarkers were used and included interphase FISH (iFISH), virtual FISH (vFISH), SKY92, ISS and some combinations thereof. The other combination is SKY92 + ISS recently identified to be superior to all other combinations of one or two biomarkers for identification of both high risk and low risk patients.
Aims
To demonstrate and compare the robustness of the prognostic value of the SKY92, ISS, SKY92 + ISS and various FISH marker risk classification methods across a wide variety of clinical datasets including NDMM and RRMM, young/elderly patients and a wide diversity of treatments.
Methods
Nine GEP datasets publicly available or obtained by analysis of the CE IVD MMprofiler assay were used (Table 1, rows) and evaluated for 17 biomarkers (Table 1, columns). In each analysis the Cox proportional hazard ratio (HR) and its p-value are calculated. Interphase FISH (iFISH) data was not available for all datasets, therefore, the so-called Virtual FISH markers (as classified by GEP signatures with high accuracy) were determined using the MMprofiler assay algorithms. Note that there is no virtual FISH signature for del(17p). We combined the subtypes [t(14;16) + t(14;20)] since they are rare but both predictors of poor outcome.
Results
All available data was used to compare prognostic HR and p-values for overall survival in nine MM cohorts, see Table 1. Note that HOVON-65/GMMG-HD4 was the training set for SKY92. iFISH data was only available for a limited set of studies. Therefore, additionally, vFISH results are shown (HR in white). For some of the datasets, the microarray platform was not HG-U133Plus2 - for which the MMprofiler vFISH software was developed - such that no vFISH call was available. There was also missing ISS data for 4 study cohorts. SKY92 could be determined in all datasets and was always prognostic (Table 1, white across the column). ISS and the combination of ISS + SKY92 could be determined in 5 datasets and were significant in all 5 of the studies. The FISH markers did not show robust prognostic values across the evaluated datasets. Only gain(1q) showed prognostic value in 4 out of 6 datasets. Hazard ratios are given in Table 1 and cell-shading is white where p-values were significant (<0.05).Table 1. Prognostic value (hazard ratios for OS) of ISS and genetic biomarkers in nine clinical datasets including NDMM and RRMM. White = significant (p<0.05); grey = n.s.; dark grey = NA / not available. 1) HOVON-65/ GMMG-HD4 |n=329|, 2) HOVON-87/NMSG-18 |n=143|, 3) MRC-IX |n=246|, 4) MMGI |n=91|, 5) TT3 |n=139|, 6) TT6 |n=55|, 7) Czech E-MTAB-1038 |n=66|, 8) TT2 |n=351|, 9) APEX |n=264|. FISH column HR with underscores are based on vFISH, others on iFISH. Inf = infinitely large.
Conclusion
SKY92, and its combination with ISS, have demonstrated to be robust prognostic markers in MM while the evaluated FISH markers do not show robustness for prognostic purposes.
Session topic: E-poster
Keyword(s): FISH, Gene expression profile, Multiple myeloma, Prognostic factor
Abstract: E1262
Type: Eposter Presentation
Background
Multiple Myeloma (MM) is recognized as a heterogeneous group of patients with varying response and outcome of their disease, associated with various risk factors including genetic aberrations. With increasing availability of genetic data, ever more reliable conclusions can be drawn about the relevance of individual and combined biomarkers. Here we compare multiple stratifications of MM to evaluate their value in relation to overall survival (OS). All available biomarkers were used and included interphase FISH (iFISH), virtual FISH (vFISH), SKY92, ISS and some combinations thereof. The other combination is SKY92 + ISS recently identified to be superior to all other combinations of one or two biomarkers for identification of both high risk and low risk patients.
Aims
To demonstrate and compare the robustness of the prognostic value of the SKY92, ISS, SKY92 + ISS and various FISH marker risk classification methods across a wide variety of clinical datasets including NDMM and RRMM, young/elderly patients and a wide diversity of treatments.
Methods
Nine GEP datasets publicly available or obtained by analysis of the CE IVD MMprofiler assay were used (Table 1, rows) and evaluated for 17 biomarkers (Table 1, columns). In each analysis the Cox proportional hazard ratio (HR) and its p-value are calculated. Interphase FISH (iFISH) data was not available for all datasets, therefore, the so-called Virtual FISH markers (as classified by GEP signatures with high accuracy) were determined using the MMprofiler assay algorithms. Note that there is no virtual FISH signature for del(17p). We combined the subtypes [t(14;16) + t(14;20)] since they are rare but both predictors of poor outcome.
Results
All available data was used to compare prognostic HR and p-values for overall survival in nine MM cohorts, see Table 1. Note that HOVON-65/GMMG-HD4 was the training set for SKY92. iFISH data was only available for a limited set of studies. Therefore, additionally, vFISH results are shown (HR in white). For some of the datasets, the microarray platform was not HG-U133Plus2 - for which the MMprofiler vFISH software was developed - such that no vFISH call was available. There was also missing ISS data for 4 study cohorts. SKY92 could be determined in all datasets and was always prognostic (Table 1, white across the column). ISS and the combination of ISS + SKY92 could be determined in 5 datasets and were significant in all 5 of the studies. The FISH markers did not show robust prognostic values across the evaluated datasets. Only gain(1q) showed prognostic value in 4 out of 6 datasets. Hazard ratios are given in Table 1 and cell-shading is white where p-values were significant (<0.05).Table 1. Prognostic value (hazard ratios for OS) of ISS and genetic biomarkers in nine clinical datasets including NDMM and RRMM. White = significant (p<0.05); grey = n.s.; dark grey = NA / not available. 1) HOVON-65/ GMMG-HD4 |n=329|, 2) HOVON-87/NMSG-18 |n=143|, 3) MRC-IX |n=246|, 4) MMGI |n=91|, 5) TT3 |n=139|, 6) TT6 |n=55|, 7) Czech E-MTAB-1038 |n=66|, 8) TT2 |n=351|, 9) APEX |n=264|. FISH column HR with underscores are based on vFISH, others on iFISH. Inf = infinitely large.
Conclusion
SKY92, and its combination with ISS, have demonstrated to be robust prognostic markers in MM while the evaluated FISH markers do not show robustness for prognostic purposes.
Session topic: E-poster
Keyword(s): FISH, Gene expression profile, Multiple myeloma, Prognostic factor
{{ help_message }}
{{filter}}