

Contributions
Type: Oral Presentation
Presentation during EHA20: From 14.06.2015 08:15 to 14.06.2015 08:30
Location: Room Strauss 1
Background
After the clinical success of TKIs in treating patients with CML, the clinical management of these patients became the core of patient care. RT-qPCR is the current gold standard for monitoring patients’ response to therapy. Transcript levels are prognostic and capable of stratifying the patients in to risk groups as early as 3 month after therapy induction. Several molecular milestone have been introduced based on the log reduction of the transcript levels in response to therapy. Optimal response has been defined by the recently revised ELN guidelines as BCR-ABL1 levels to be ≤ 10% by 3 month, <1% by 6 month, ≤ 0.1% by 12 month then ≤ 0.1% at any time. However, these percentages hugely vary from one centre to the other due to inherent limitations introduced by the gold standard method of quantification, unless expressed on the International scale. Recently, dPCR has been introduced as a method of quantification that promises simplified assay standardisation procedures mainly for being a method of absolute quantification as opposed to the relative quantification ascribed to the gold standard. In this study, we sought to optimize the use of such a platform, the QS3D, for our routine practice in addition to a performance comparison study with other dPCR platforms.
Aims
In this study, we sought to optimize the use of the dPCR platform, the QS3D, for our routine practice in addition to a performance comparison study with other widely used dPCR platforms, namely the Bio-Rad QX200 and RainDance. .
Methods
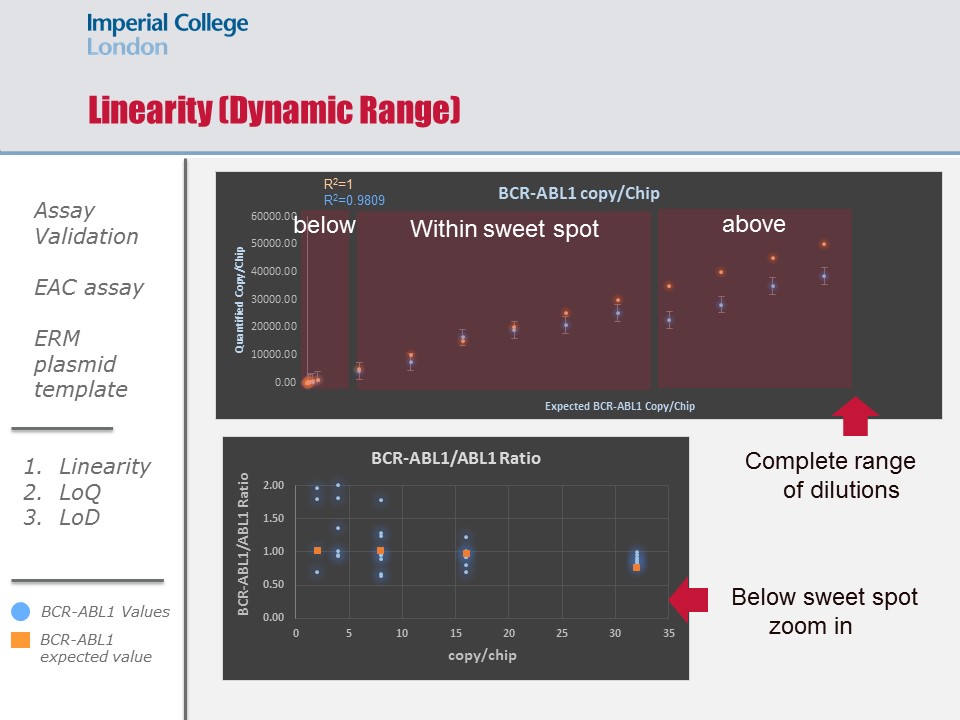
For validating the EAC assay on the QS3D dPCR, we used the reference ERM-AD623 plasmid to assess the linearity metric of the platform by running a series of dilutions that fell within, below and above the sweet spot of the chip used. To assess the bias introduced to our measurements of BCR-ABL1 transcript ratios in patient material using our in-house generated Wessex plasmid, we ran a series of dilutions using the Wessex plasmid and compared it against the reference plasmid. To assess the limit of detection, we ran 6 categories of patient material at different disease ranges on the IS: 20%, 10%, 1%, 0.1%, 0.01%, and 0.001% (10 samples per category). These 60 patient material were also ran on the two other platform for comparing their performances.
Results
Results
Linearity was maintained within the sweet spot and down to 3 molecules per chip. Inte and intra experimental variations were insignificant indicating excellent reproducibility (p=0.2). Linearity above the sweet spot was maintained, However a systematic underestimation was observed (p=0.05). There was a systematic bias introduce using out in-hour plasmid (p=0.001), and this bias was factored into the quantification of the cNDA molecules collected form the patients’ samples. The limit of detection of the platform was concordant with that of the gold standard down to 0.1% IS (p=0.2); however dPCR demonstrated better precision in quantifying molecules in samples at the 0.01% IS level (p=0.07), and had improved sensitivity and precision in quantifying molecules in samples at the 0.001% IS level (p=0.06). Platform comparison showed reassuring concordance in sensitivity at all levels (p=0.16-0.4).
Summary
In conclusion, our investigations demonstrate that the QS3D digital PCR platform demonstrates performance characteristics to favour its implementation in routine clinical use with a one log increased limit of detection compared to the gold standard.
Keyword(s): Chronic myeloid leukemia, Minimal residual disease (MRD), Molecular
Session topic: CML: Molecular-cytogenetic diagnostics
Type: Oral Presentation
Presentation during EHA20: From 14.06.2015 08:15 to 14.06.2015 08:30
Location: Room Strauss 1
Background
After the clinical success of TKIs in treating patients with CML, the clinical management of these patients became the core of patient care. RT-qPCR is the current gold standard for monitoring patients’ response to therapy. Transcript levels are prognostic and capable of stratifying the patients in to risk groups as early as 3 month after therapy induction. Several molecular milestone have been introduced based on the log reduction of the transcript levels in response to therapy. Optimal response has been defined by the recently revised ELN guidelines as BCR-ABL1 levels to be ≤ 10% by 3 month, <1% by 6 month, ≤ 0.1% by 12 month then ≤ 0.1% at any time. However, these percentages hugely vary from one centre to the other due to inherent limitations introduced by the gold standard method of quantification, unless expressed on the International scale. Recently, dPCR has been introduced as a method of quantification that promises simplified assay standardisation procedures mainly for being a method of absolute quantification as opposed to the relative quantification ascribed to the gold standard. In this study, we sought to optimize the use of such a platform, the QS3D, for our routine practice in addition to a performance comparison study with other dPCR platforms.
Aims
In this study, we sought to optimize the use of the dPCR platform, the QS3D, for our routine practice in addition to a performance comparison study with other widely used dPCR platforms, namely the Bio-Rad QX200 and RainDance. .
Methods
For validating the EAC assay on the QS3D dPCR, we used the reference ERM-AD623 plasmid to assess the linearity metric of the platform by running a series of dilutions that fell within, below and above the sweet spot of the chip used. To assess the bias introduced to our measurements of BCR-ABL1 transcript ratios in patient material using our in-house generated Wessex plasmid, we ran a series of dilutions using the Wessex plasmid and compared it against the reference plasmid. To assess the limit of detection, we ran 6 categories of patient material at different disease ranges on the IS: 20%, 10%, 1%, 0.1%, 0.01%, and 0.001% (10 samples per category). These 60 patient material were also ran on the two other platform for comparing their performances.
Results
Results
Linearity was maintained within the sweet spot and down to 3 molecules per chip. Inte and intra experimental variations were insignificant indicating excellent reproducibility (p=0.2). Linearity above the sweet spot was maintained, However a systematic underestimation was observed (p=0.05). There was a systematic bias introduce using out in-hour plasmid (p=0.001), and this bias was factored into the quantification of the cNDA molecules collected form the patients’ samples. The limit of detection of the platform was concordant with that of the gold standard down to 0.1% IS (p=0.2); however dPCR demonstrated better precision in quantifying molecules in samples at the 0.01% IS level (p=0.07), and had improved sensitivity and precision in quantifying molecules in samples at the 0.001% IS level (p=0.06). Platform comparison showed reassuring concordance in sensitivity at all levels (p=0.16-0.4).
Summary
In conclusion, our investigations demonstrate that the QS3D digital PCR platform demonstrates performance characteristics to favour its implementation in routine clinical use with a one log increased limit of detection compared to the gold standard.
Keyword(s): Chronic myeloid leukemia, Minimal residual disease (MRD), Molecular
Session topic: CML: Molecular-cytogenetic diagnostics